This survey covers government purchased products and services which fell under the following voluntary measures related to government procurement: "Procedures for Government Procurement on Products (Operational Guidelines)", "Measures on Japanese Public Sector Procurement of Telecommunications Products and Services", and the "Measures Related to Japan's Public Sector Procurement of Medical Technology Products and Services".
In other words, it covers in principle procurement contracts made by central government entities and public corporations given in the following Table A, and products and services of which value were above the threshold given below. *
From 1 January 1995 to 31 March 1996: 100,000 SDR (17 million yen)
From 1 April 1996 to 31 March 1998: 100,000 SDR (14 million yen)
From 1 April 1998 to 31 December 1999: 100,000 SDR (17 million yen)
*(Note1) Procurement for public works (including architectural planning and consultancy ) is excluded from this survey.
(Note2) The figures for 1995 only cover goods, reflecting the fact that only procurement of goods were covered by the old Agreement on Government Procurement at that time.
Table A: Changes in the Entities Covered by this Survey of Government Procurement Figures [1]
| GPA ( 1 January 1996〜) | ||||
|
1 October 1994〜 (102) |
||||
|
1 April 1992 to 30 September 1994 (89) |
||||
|
1 October 1985 to 31 March 1992 (66) |
||||
| Entities covered by the current Agreement onGovernment Procurement (50) | Entities added by the Action Program in 1985 (16) | Entities added by the Arrangement of Government Procurement in 1991 (23) | Entities added by the Procedures for Government Procurement (Operational Guidelines) in 1994 (13) | |
House of Representatives House of Councilors Supreme Court Board of Audit Cabinet* National Personnel Authority Prime Minister's Office Fair Trade Commission National Public Safety Commission (National Police Agency) Environmental Disputes Coordination Commission Financial Services Agency Imperial Household Agency Management and Coordination Agency Hokkaido Development Agency Defense Agency Economic Planning Agency Science and Technology Agency Environment Agency Okinawa Development Agency National Land Agency Ministry of Justice Ministry of Foreign Affairs Ministry of Finance Ministry of Education Ministry of Health and Welfare Ministry of Agriculture, Forestry and Fisheries Ministry of International Trade and Industry Ministry of Transport |
Ministry of Posts and Telecommunications Ministry of Labor Ministry of Construction Ministry of Home Affairs Hokkaido Railway Company East Japan Railway Company Central Japan Railway Company West Japan Railway Company Shikoku Railway Company Kyushu Railway Company Japan Freight Railway Company Japan Tobacco Inc. Nippon Telegraph and Telephone Co. National Life Finance Corporation Housing Loan Corporation Agriculture, Forestry and Fisheries Finance Corporation Japan Finance Corporation for Small Business Japan Finance Corporation for Municipal Enterprises Social Welfare and Medical Service Corporation Okinawa Development Finance Corporation Development Bank of Bank Japan Bank for International Cooperation |
Water Resources Development Public Corporation New Tokyo International Airport Facility Japan Highway Public Corporation Japan Environment Corporation Japan International Cooperation Agency Pension Welfare Service Public Corporation Labor Welfare Corporation Employment and Human Resources Development Organization of Japan Japan Consumer Information Center Japan Information Center of Science and Technology Japan Foundation University of the Air Foundation Japan Racing Association Japan External Trade Organization New Energy and Industrial Technology Development Organization |
Japan Regional Development Agency Japan National Oil Corporation Metropolitan Expressway Public Corporation Urban Development Corporation Power Reactor and Nuclear Fuel Development Corporation Metal Mining Agency of Japan Japan Small Business Corporation Postal Life Insurance Welfare Corporation Organization for Workers' Retirement Allowance Mutual Aid Teito Rapid Transit Authority Northern Territories Issue Association Japan Atomic Energy Research Institute Pollution-related Health Damage Compensation and Prevention Association Fund for the Promotion and Development of the Amami Islands Japan Scholarship Foundation Promotion and Mutual Aid Corporation for Private Schools of Japan Social Insurance Medical Fee Payment fund Association for Welfare of the Mentally and Physically Disabled Mutual Aid Association of Agriculture, Forestry and Fishery Corporation Personnel Japan Keirin Association Japan Motorcycle Racing Organization Japan Institute of Labor Mutual Aid Fund for Official Casualties and Retirement of Volunteer Firemen |
Japan Green Resources Corporation Corporation for Advanced Transport and Technology Japan Railway Construction Public Corporation Hanshin Expressway Public Corporation Honshu-Shikoku Bridge Authority Livestock Industry Promotion Corporation The Institute of Physical and Chemical Research (RIKEN) National Education Center Japan Arts Council Japan Society for the Promotion of Science The National Association of Racing Farmer's Pension Fund Japan National Tourist Organization |
[Note 1] The individual procurement entities are listed only under the names they held as of the end of December 1999, and the names of special corporations before their merger or abolition are not given.
[Note 2] The new agreement also covers "all prefectural governments entitled "To," "Do," "Fu," and "Ken," and all designated cities entitled "Shitei-toshi," covered by the Local Autonomy Law," but they are not subject of this survey.
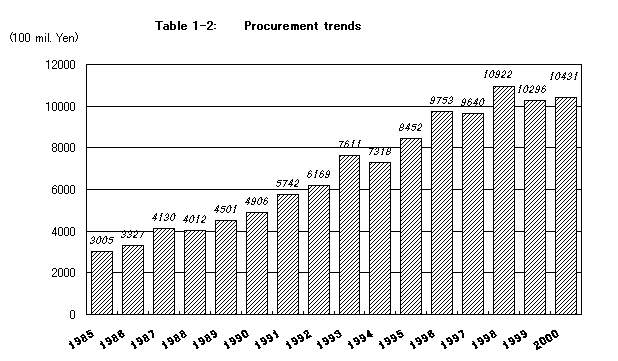
The total value for government procurements of goods and services for 2000 was 1.0431 trillion yen, a increase of 1.3% from the previous year, (Table 1-1).
Table 1-2 shows the trends, along with the past results reported to the Committee for Drawing Up and Promoting the Action Program to date.
Table 1-1: Total value and number of government procurement contracts
| (100mil. Yen or Number of contracts) | |||||||||||||||||||||||||||||||||
|

The ratios of competitive tendering contracts to single tendering contracts vary significantly according to whether the items procured were goods or services. In 2000 about 85% of the goods procured were obtained through open tendering procedures. In contrast, looking only at the service contracts, more than half of the procurements were with single tendering procedures, accounting for more than 70% of the spending on services procurements.
Table 2: Breakdown of procurements by types of goods and services, and by contract type
| (Upper col.: Number of contracts, Lower col.: Value(100 mil. Yen)) | |||||||||||||||||||||||||||||||||||
|
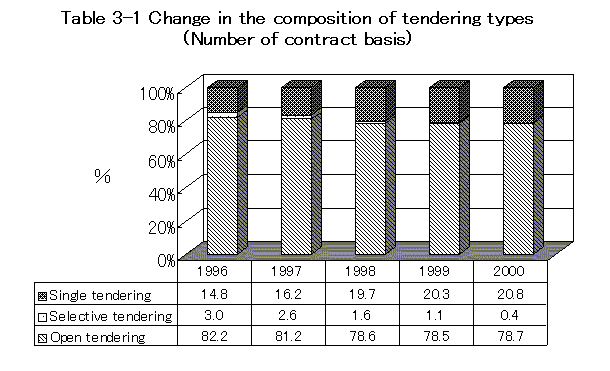
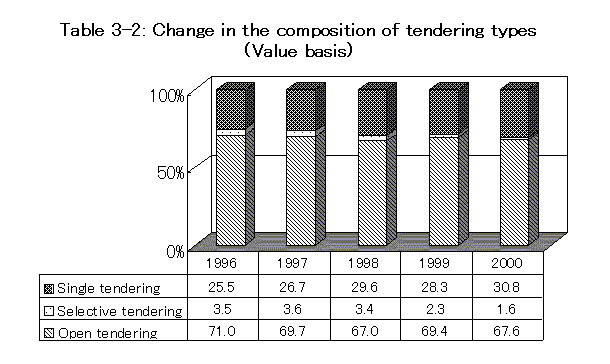
The open tendering procedures continue to occupy a large portion of the total,
in terms of numbers of contracts, as well as on value basis. (About 80% on a number
of contract base, and about 70% on a value base).
On the other hand, the proportion of single tendering contracts has grown. In
2000, the level was about the same as 1999, which was the highest level since
the investigations began.


The contracts through selective tendering procedures are decreasing each year.
In 2000 there were 68 of these contracts, which was less than 1% of the total number
of contracts.
For the procurement of goods and services the method of selective tendering is
confined to application to an extremely limited number of cases.
Table 4: Reasons for selective tendering procedures
| Reasons | 1998 | 1999 | 2000 |
| Number of contracts | Number of contracts | Number of contracts | |
| Ratio (%) | Ratio (%) | Ratio (%) | |
| Only a small number of suppliers is expected to tender because of the nature or the purpose of the contract | 87 | 63 | 54 |
| 33.3 | 35.6 | 79.4 | |
| Use of open tendering is expected to be disadvantageous for procuring entities | 142 | 114 | 11 |
| 54.4 | 64.4 | 16.2 | |
| Others | 32 | 0 | 3 |
| 12.3 | 0.0 | 4.4 | |
| Total | 261 | 177 | 68 |
Of the reasons listed in the 15th Article of the WTO Agreement on Government Procurement as the conditions of single tendering procedure, the ones most often cited for the adoption of single tendering procedures were that " in the absence of tenders in response to an open or selective tendering," " a change of supplier would harm compatibility with already existing products or equipment," and that " when, for works of art or for reasons connected with protection of exclusive rights such as patents or copyrights, the products can be supplied only by a particular supplier." As in 1998 and 1999, these reasons accounted for more than 90 percent of cases. (Table 5).
Table 5: Reasons for use of single tendering procedures
| Reasons | 1998 | 1999 | 2000 |
| Number of contract | Number of contract | Number of contract | |
| Ratio (%) | Ratio (%) | Ratio (%) | |
| In the absence of tenders in response to an open or selective tender | 1,302 | 1,117 | 950 |
| 41.8 | 35.7 | 29.7 | |
| When, for works or art or for reasons connected with protection of exclusive rights such as patents or copyrights, the products can be supplied only by a particular supplier | 685 | 812 | 981 |
| 22.0 | 25.9 | 30.7 | |
| When, for reasons of extreme urgency, the products could not be obtained in time by means of open or selective tendering procedures | 48 | 47 | 59 |
| 1.5 | 1.5 | 1.8 | |
| The change of supplier would harm interchangeability with already existing products or equipment | 991 | 1,048 | 1,131 |
| 31.8 | 33.5 | 35.3 | |
| When an entity procures prototypes or a first product which are developed at its request | 65 | 93 | 54 |
| 2.1 | 3.0 | 1.7 | |
| Others | 22 | 16 | 25 |
| 0.7 | 0.5 | 0.8 | |
| Total | 3,113 | 3,133 | 3,200 |
In 2000, 6.9% of the total spending on procurements was to foreign businesses, equivalent to 2.7% of the number of contracts. In comparison to 1999, the ratio of foreign supplier's awards increased both in value and the number of contracts.
Table6-1: Ratio of Procurement from Foreign Suppliers
| (%) | |||||||||||||||||||||
|
|||||||||||||||||||||
Table 6-2: Nation's Origin in the Foreign Supplier's Award
| Number | Value(100 million yen) | |
| USA | 251 | 495.5 |
| EU | 109 | 196.7 |
| Others | 51 | 26.2 |
| Total | 411 | 718.4 |
In 2000, the trend that foreign suppliers' ratio of awards or contracts is higher than that of tenders has continued.
Table 7: Ratio of Foreign Suppliers Responding to Tenders and Ratio of Awards to the Foreign Suppliers(2000)
| (%) | |||||||||
|
(Note1)
Ratio of tender: The number of foreign tenders/The total number of tenderers
Ratio of awards: The number of contracts awarded to foreign tenderers/The total number of tenderers in selective tendering procedures
Ratio of contracts: The number of contracts made by foreign suppliers/The number of singletendering procedures
The proportion of foreign goods and services obtained through government procurement in Japan has remained at about the same level for the past 3 years. In 2000, foreign goods and services accounted for 14.7% of the total procurement spending, and 19.6% of the total number of contracts. In addition, considering only the procurement of goods, foreign goods accounted for 17.4% of the spending, and 23.7% of the number of contracts.
Table 8: Ratios of Foreign Products and Services
| (%) | ||||||||||||
|
[Note1] Figures in parentheses are for products only.
In 2000, products and services from the United States accounted for 64% on a value basis and approximately 50% on a number of contracts basis.
Table 9-1: Breakdown of foreign products and services by place of origin (value base)
| (100 million yen, number, %) | |||||||||||||||||||||||||||||||||||
|
Table 9-2: Breakdown of Foreign Products and Services by Place of Origin
(number of contract base)
| (100 million yen, number, %) | ||||||||||||||||||||||||||||||||||||
|
Table 10 shows breakdowns of Japanese government procurement by product category (value basis), which are then broken down into list of products with ratios for foreign made products.
The total value of procured products amounted to approximately 789.2 billion yen. The largest value for procured items included "office machines and automatic data processing equipment" (personal computers, typewriters, projection screens, etc.), "telecommunications and sound recording and reproducing apparatus and equipment"(TV, radio, radar, video, recorder, etc.) "scientific and controlling instruments and apparatus" (binoculars, thermometers, voltmeters, micrometers, etc.)".
These three categories accounted for about 57% of total procurement value.
The categories with the highest percentage of foreign products were "mineral products" (soil and rocks, crude heavy oil, metal ores, etc.) (approx. 91%),"aircraft and associated equipment" (airplanes, balloons, propellers, parachutes, simulators for aviation, etc.) (approx. 98%).
Table 10: Total procurements by product (2000)
| (100 Million Yen, %) | ||||||||||||||||||||||||||||||||||||||||||||||||||||||||||||||||||||||||||||||||||||
|
Table 11 offers breakdowns of Japanese government procurements by service categories (value basis), and presents the ratio of foreign services.
Total procurement amounted to approximately 254.0 billion yen and of that approximately 177 billion yen (70%) was taken up by "Computer and related services," (computer programming, data processing, etc.).
Foreign services are also concentrated in this area.
Table 11: Total procurements by types of services(2000)
| (Units: 100 million yen, %) | |||||||||||||||||||||||||||||||||||||||||||||||||||||||||
|
Table 12 shows Japanese government procurement by product categories and offers a breakdown of foreign product ratios.
The total number of product contracts amounted to 12,332, and the category of"photographic apparatus and equipment optical goods, and clocks" (film, cameras,
projectors, chronometers, etc.), accounted for about 27% of all procurement contracts.
The categories with the highest percentage of foreign products were "mineral products" (soil and rocks, crude heavy oil, metal ores, etc.) (approx. 97%), and" aircraft and associated equipment" (approx. 88%).
Table 12: Number of Procurement Contracts by Product Categories(2000)
| (Units: number of contracts, %) | ||||||||||||||||||||||||||||||||||||||||||||||||||||||||||||||||||||||||||||||||||||
|
Table 13 offers a breakdown of Japanese government procurement by service categories (on a contract basis), which is broken down into foreign service ratios.
The number of contracts amounted to 3,016 and of this number 1,375 were for "Computer and related services." (computer programming, data processing, etc.)
Table 13: Number of procurement contracts by type of services(2000)
| (Units: number of contracts, %) | |||||||||||||||||||||||||||||||||||||||||||||||||||||||||
|
The voluntary measures (Procedures for Government Procurement of Products [Operational Guidelines]) encourage the adoption of the Overall-Greatest-Value evaluation method(OGV) where the lowest-price-award method is deemed inadequate. In addition, in the areas of computer products and services, telecommunications products and services and medical technology products and services, with regard to high value items (see note), it is obligatory in the voluntary measures to apply the OGV.
In 2000, the OGV was adopted in 557 procurement contracts, representing a rise on the previous year to occupy 3.6% of total procurement. Of these contracts, 123 were awarded to foreign products and services.
(Note) For computer products and services, this includes all procurement above 800,000 SDRs. In the area of telecommunications products and services and medical technology products and services, until 31 March 1996, this included all procurement above 800,000 SDRs, from 1 April 1996 all procurement above 600,000 SDRs, from 1 April 1997 all procurement above 400,000 SDRs and from 1 April 1998 all procurement above 385,000 SDRs.
Table 14: Implementation of Overall-Greatest-Value Evaluation Method
| (Figures in parentheses are percentages) | |||||||||||||||||||||||||||
|
|||||||||||||||||||||||||||
Responses to pre-bid requests for submission of materials and comments on draft specifications are illustrated in Table 15-1 and Table 15-2.
Table 15-1: Response to Requests for Submission of Materials
| (Number of responses) | ||||||||||||||||||||||||
|
Table 15-2: Response to Requests for Comments on Draft Specifications
| (Number of responses) | ||||||||||||||||||||||||
|
Under the current WTO Agreement on Government Procurement, the period for receiving tenders from the date of publication of the Notice of Invitation to Tender is set at a minimum of 40 days. However, as a voluntary measure, the Government of Japan's "Understanding on Government Procurement" issued in November 1991 stipulates that the period should be no less than 50 days. This measure has been in effect since 1 April 1992.
Looking at the average period for the receipt of tenders over the last five years shows that the period of 50 days or more has always been secured.
Table 16: Average period for the receipt of tenders
| (days) | ||||||||
|
In order to explain the planned procurement published in the official gazette (kanpo) in greater detail, the Ministry of Foreign Affairs and each procurement entity sponsors government procurement seminars at the beginning of, or as early as possible in, the fiscal year. (The Ministry of Foreign Affairs sponsored a seminar on 22-23 April, 1999.)
Table 17: Attendance at Government Procurement Seminars
| Classification | 1998 | 1999 | 2000 | |
| Foreign Ministry Sponsored |
Number of domestic attendants |
94 | 104 | 69 |
| Number of foreign attendants |
39 | 50 | 31 | |
| Sponsored by other entities |
Number of domestic attendants |
581 | 687 | 839 |
| Number of foreign attendants |
82 | 90 | 130 | |
| Total | 796 | 931 | 1069 | |
Table 18 incorporates data on top procurement entities and ratios in total procurement.
Table 18: Entities with a large amount/number of procurement
| (%) | |||||||||||||||||||||||||||||||||
|
Note: ( ) means proportion in the total value.